
igoaClarity is everything. Whether you're presenting complex data or mapping out a project plan, a well-crafted diagram can make all the difference. Diagrams transform abstract ideas into visual stories. They help your audience grasp information quickly and accurately.
But not all diagrams are created equal. An effective diagram can help you communicate essential information that viewers can understand. To do this, you need the right diagramming tool.
Diagramming tools prove essential in setting down clear steps for multiple workflows, processes, or decision sequences. Yet, many times, we find ourselves creating diagrams that remain stagnant instead of actively using them to guide us in our processes.
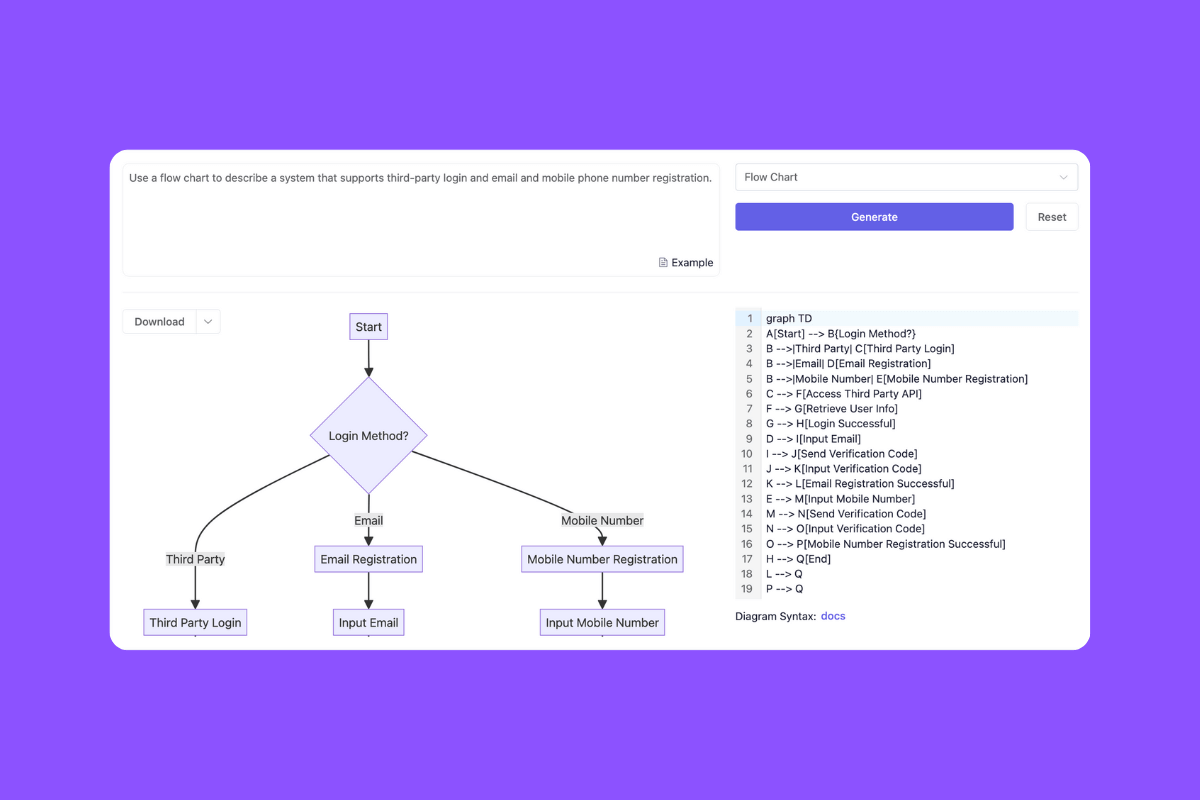
When demands are high and you're looking to swiftly turn your flood of ideas into a cohesive framework, the use of integrated AI significantly speeds up the process of delivering product requirements, changing the timeline from days to a mere few minutes. It's like having a premade template for project planning at your disposal, one that lets you fill out your content effectively.
With this method, you'll have a functional chart ready for deployment in a substantially shorter time than it would take to build one from scratch in typical word-processing software. Not to mention, you'll also get the added advantage of seeing all project timelines in one place, allowing you to make informed decisions about ongoing and future projects. Embrace this approach for improved efficiency and productivity.

Uses of Flowcharts
Flowcharts are versatile and effective tools that help simplify complex processes. They can turn huge volumes of data and your ideas into visuals. This improves understanding across teams. Some key uses include:
1. Process Visualization: Flowcharts turn abstract processes and data into clear, step-by-step visuals. This makes it easier to see how tasks, decisions, and workflows connect to help you achieve your goals.
2. Problem Solving: By mapping out every step, flowcharts reveal issues such as bottlenecks, inefficiencies, or areas prone to errors in your workflow. This helps teams troubleshoot effectively.
3. Decision-Making: Flowcharts give you a clear view of options and outcomes to support faster and more informed decision-making.
4. Training and Documentation: Flowcharts are effective learning aids for new team members or employees, giving you a visual guide to company procedures or project workflows.
5. Communication Across Teams: Flowcharts help bridge understanding gaps, especially in cross-functional or remote teams. They provide a single visual reference that everyone can follow.
Read More: From Brainstorm to Blueprint: How DiagramGPT Turns Ideas Into Visuals Instantly
How Diagramming Tools Help Turn Ideas into Visuals
Diagramming tools make it easier than ever to convert concepts and ideas into clear, professional visuals. Here's how they help:

Drag-and-Drop Simplicity
Modern tools like Leiga allow users to create diagrams without the need for advanced design skills. It makes the process fast and intuitive.
Pre-Built Templates and Symbols
With ready-made shapes, icons, and templates, you can create diagrams and represent processes, systems, or hierarchies accurately without starting from scratch every time.
Collaboration Features
Many modern tools support real-time collaboration, letting multiple team members edit, comment, and refine diagrams together.
Customizability
You can tweak colors, shapes, connections, and layouts to match your workflow or brand, making visuals clearer and more engaging.
Integration with Other Tools
Diagramming tools often integrate with project management, documentation, or presentation tools, making it easy to embed visuals where they’re needed most.
Speeding Up Idea Translation
By turning abstract thoughts into visual structures, diagramming tools help teams brainstorm, communicate, and plan faster, ensuring ideas don’t get lost in translation.
Read More: Guide to AI Integrations and Workflow Automation for Your Tech Stack
Preparation for Creating a Flowchart
For this walkthrough, we'll be using Microsoft Excel with the latest version. Take note that the procedure and interface might change if you are using a different version.
Creating an operational diagram within this tool is straightforward, and there are a couple of ways you could go about doing it:
- Leveraging pre-designed process diagrams available in the tool's features.
- Building a personalized operational diagram from scratch.
The starting point is simple: write down your process in a sequential order, from start to end.
Keeping this list ready can speed up the later stages of the creation, as it gives you a clear picture of the number of steps required and their exact placement.
It could lead you down an endless loop of time-consuming adjustments. Remember, this tool is not designed for mapping ideas instantaneously. To synchronize your work and make a clear step-by-step process to draw a flowchart, you could use a tool such as Leiga. This tool provides the missing features of Microsoft to help you create a clear flowchart with additional chart features if needed.
If you feel inclined to use a pre-designed graphic, the following instructions should guide your next steps.

Traditional Method: Creating a Flowchart Using SmartArt Graphics
Before modern diagramming tools became popular, most people used Microsoft SmartArt to create flowcharts. While this is a functional tool, the traditional method has limited customization and involves manual formatting. This can be quite time-consuming for complex workflows. Let's take a closer look at how flowcharts are built using SmartArt graphics.
1. Establish Your Workspace and Choose a Diagram
First, adjust your workspace for the best possible visibility for your operational diagram. Head to the Layout section, choose Orientation, and switch to Landscape mode.
Next, have your process sequence ready, continue to the Insert Section, and then go to SmartArt. Select Process Diagram, and pick your favorite diagram style.
2. Insert Your Process List
Once you select your preferred process chart, it gets displayed in your workspace. Update it with your pre-prepared process list within the available Text Pane window. Navigate to the SmartArt Design section, and select Text Pane.
3. Modify Your Operational Diagram
The SmartArt Design section is the hub for all fine-tuning. You can change color schemes, enhance symbol styles, and add innovative shapes to finalize your design.
Alternative Method: Developing Using Basic Symbols
An alternative to SmartArt is to build flowcharts manually using basic shapes and symbols. This gives you more flexibility and control. You can customize every element to fit your workflow.
1. Add Diagram Elements for Each Step
Proceed to the Insert section, select Shapes, navigate to Flowchart, choose a shape, and then place it anywhere within your document.
2. Customize Your Diagram Elements
Though color and size customization usually come later, it's more efficient to format before duplicating them with this tool.
Navigate to the Shape Format section to view your modification options. After setting your preferred element style, copy and paste it as required.
3. Input Text Within Diagram Elements
To input text into the elements, expand them first. Select an element, choose additional elements, and then drag from an element's corner to enlarge. Click on each element and input your corresponding steps.
4. Connect Steps with Arrows
Time to connect your steps. Head to the Insert section, go to Shapes Lines, and choose Arrow.
Modify the arrow in the Diagram Format tab. Make sure it's activated for modifications. After adjusting the arrow, duplicate it for the remaining operational diagram steps using copy and paste.
Creating an operational diagram requires significant time and expertise, which could be better allocated to the actual action plan.
Designing Dynamic Operational Diagrams Effortlessly
Reimagine your workflow with Leiga and vastly improve your productivity. Formatting tasks, while meticulous, are futile if they don't foster tangible progress in your projects. Although versatile tools such as Word allow the creation of an array of documents, they tend to fall short in efficiency, especially in the current work environment that necessitates seamless collaboration regardless of physical location.
Assembling a team to create flowcharts in Word is unlikely due to the software's complexity and the daunting multi-step process it entails. What you need for fruitful task management and collaboration is a comprehensive productivity platform like Leiga, which facilitates the efficient organization of ideas and tasks.
Experience the convenience of accessing a curated collection of professional flowchart templates, and witness how it improves your productivity and teamwork. If the versatility of whiteboard-like software has caught your attention, feel free to explore the offerings of Leiga's Dashboard.
It includes the Widgets feature, which offers a flexible workspace for constructing flowcharts and schemes swiftly. Reap the benefits of semi-customization elements, which save you the time traditionally spent creating elements from scratch. Whether it's for presentations, brainstorming sessions, or individual projects, adding Widgets to the Dashboard is at your service.
What's more, this product feature enables you to conveniently save and integrate your flowcharts into documents or emails. Here’s a simple guide.
Create your flowchart using Leiga's Dashboard:
- Open the Dashboard feature after logging into your account
- Find the "Add Widget" feature on the top right corner of the page.
- Click on the "Project" feature and then you can select from all the available flowcharts
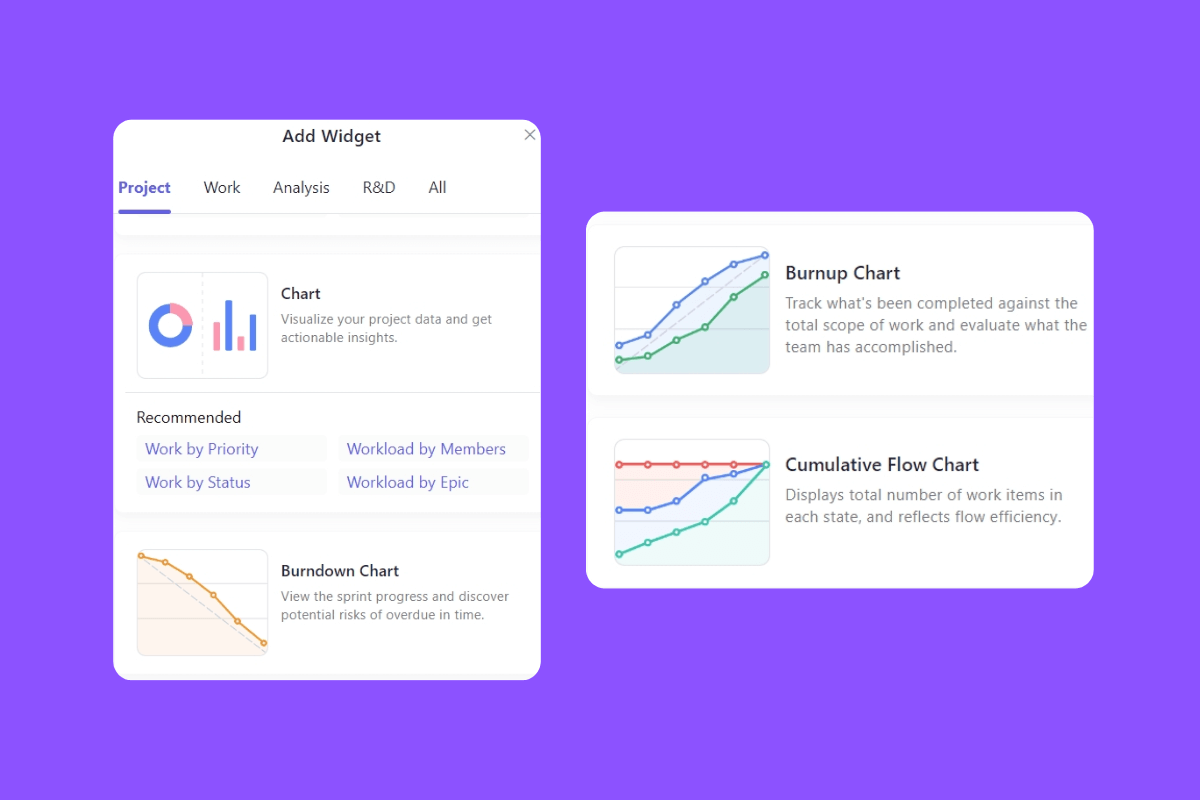
This feature has additional chart features that include
- Burndown Chart: View the sprint progress and discover potential risks of being overdue in time.
- Burnup Chart: Track what's been completed against the total scope of workload and evaluate what the team has accomplished.
- Cumulative Flow Chart: Displays the total number of work items in each state, and reflects flow efficiency.
- Kanban Widget: Display project or sprint progress and create project reports with other widgets.
Flowcharts: A More Intuitive And Effective Method
Using a pre-designed graphic helps save more time, and it makes the visualization graphs more intuitive compared to just using the basic features created by Microsoft Excel.
The Dashboard and Excel both provide functionalities for creating flowcharts, each with its unique strengths and offerings:
- User Interface: The Dashboard's user interface is intuitively designed to give you a seamless experience in creating, modifying, and managing flowcharts. Excel, on the other hand, has a more complex interface that might require a steeper learning curve for non-technical users.
- Flexibility: With the Dashboard, you can enjoy more flexibility when designing your flowchart since its design tools are easier to manipulate compared to Excel's, which is largely spreadsheet-oriented.
- Collaboration: Unlike Excel, which is more tuned for single-user operation, the Dashboard is built to support team collaboration. Updates can be seen in real-time, enabling team members to work together on flowcharts efficiently and effectively.
- Integration: The Dashboard's integration capabilities are superior to Excel's. It can be integrated with a variety of other project management tools, allowing users to incorporate their flowcharts into other parts of their project workflow with little fuss.
- Automated Updates: Unlike in Excel, where changes need to be manually inputted, the Dashboard updates changes in real-time. This automation of processes saves a lot of time and reduces potential human error.
In summary, while Excel provides basic functionalities for creating flowcharts, the Dashboard offers a more robust, user-friendly, collaborative, and integrated solution, making it the preferred choice for managing project workflows. Get a free trial of using Leiga dashboard features.
- Streamline Your Workflow with Leiga
- Effortlessly automate tasks
- Boost productivity with AI insights
- Free forever — elevate project management