Gantt charts have been the primary tool of project planning for decades. They have been around since the early 1900s, when they were used for scheduling construction work. Gantt charts have now evolved into digital dashboards, which still help in visualizing project timelines and dependencies.
However, as the teams change—remote, agile, and data-driven—the once-reliable Gantt chart cannot keep up with the demands of modern teams. The speed at which modern projects are moving is unprecedented. Changes to plans occur every hour, not every quarter.
On the other hand, Gantt charts remain rigid, manual, and often unlinked to real-time updates. What was once a tool for clarity is now a source of frustration for many teams. In this blog, we discuss the challenges of using traditional Gantt charts and how modern project management tools reinvent project planning.
The Classic Gantt Chart: A Quick Refresher
Before discussing what makes Gantt charts fail, it is important to highlight the reasons why they gained such huge popularity.
Henry Gantt created these horizontal bar charts in the early 1900s that plotted out the project tasks against the timeline. A bar corresponded to a task, and its location and length revealed start and end dates.
This visual simplicity was an advantage for teams for decades:
- They could understand the project timelines instantly.
- Task dependencies could be identified.
- Progress could be monitored visually.
Gantt charts were great when projects were smaller and linear, but nowadays, complex projects require a lot more agility.
Read More: The Ultimate Guide to Project Time Management
Where Traditional Gantt Charts Fall Short
The classic Gantt chart, although an iconic instrument for managing projects, was not really meant to be used in the modern workflow. Today's teams are constantly handling different projects, working together from afar, dealing with frequent changes in the schedule, and receiving regular feedback from various sources.
This is the point where problems begin to arise:
1. Updating the Chart Manually is Tiring
In the majority of the traditional tools, the procedure of updating Gantt charts involves a lot of manual work, such as dragging the bars, adjusting the dependencies, and reassigning timelines. A single change activates an avalanche of changes, and it is easy to overlook something.
What should have been a quick update now takes hours of admin work.
2. No Insight from Real-Time
Classic Gantt charts are not dynamic; they are static. They will not show any delays, risks, or workload imbalances until the person in charge updates the chart manually. By the time the project manager becomes aware of the problem, it is usually too late to make adjustments.
3. Poor Collaboration Across Teams
Collaboration in the remote and hybrid work era takes place through different tools like chat applications, Customer Relationship Management (CRM) systems, and documentation platforms.
The classical Gantt charts, in most cases, do not get integrated with these systems without a hitch. Hence, the issue of silo, confusion, and misalignment of priorities among teams and departments happens.
4. Overwhelming Complexity for Agile Teams
Modern teams now and then adopt agile or hybrid approaches. Nonetheless, the classical Gantt charts remain linear by nature. They find it hard to accommodate iterative sprints, changing priorities, or loose scopes. The Gantt chart then comes across as a limitation instead of a tool for guidance for agile teams.
Read More: The Ultimate Agile Boards Project Management Guide
5. Missing Context and Insights
Static bar charts can indicate the timing of tasks but not the reasons for delays, the person with too much work, or possible delays and bottlenecks that are emerging. Without insight driven by data, project scheduling will always be reactive rather than proactive.
The Evolution: From Static Charts to Smart Project Planning
The shortcomings of Gantt charts have been manually solved by the introduction of modern-day project management tools. They have transformed the Gantt chart from a mere static schedule to a living and intelligent system.
Visualization is not the only thing to be achieved. AI-driven project management tools such as Leiga aim to automate, predict, and collaborate. The new era of tools really does change the game.
1. Real-Time, Dynamic Updates
Updated modern Gantt charts automatically sync with tasks’ statuses, deadlines, and resource data. As soon as one teammate checks a task as done or asks for an extension, the whole timeline is adjusted at once. That way, there’s no manual work left and everybody sees the most current plan.
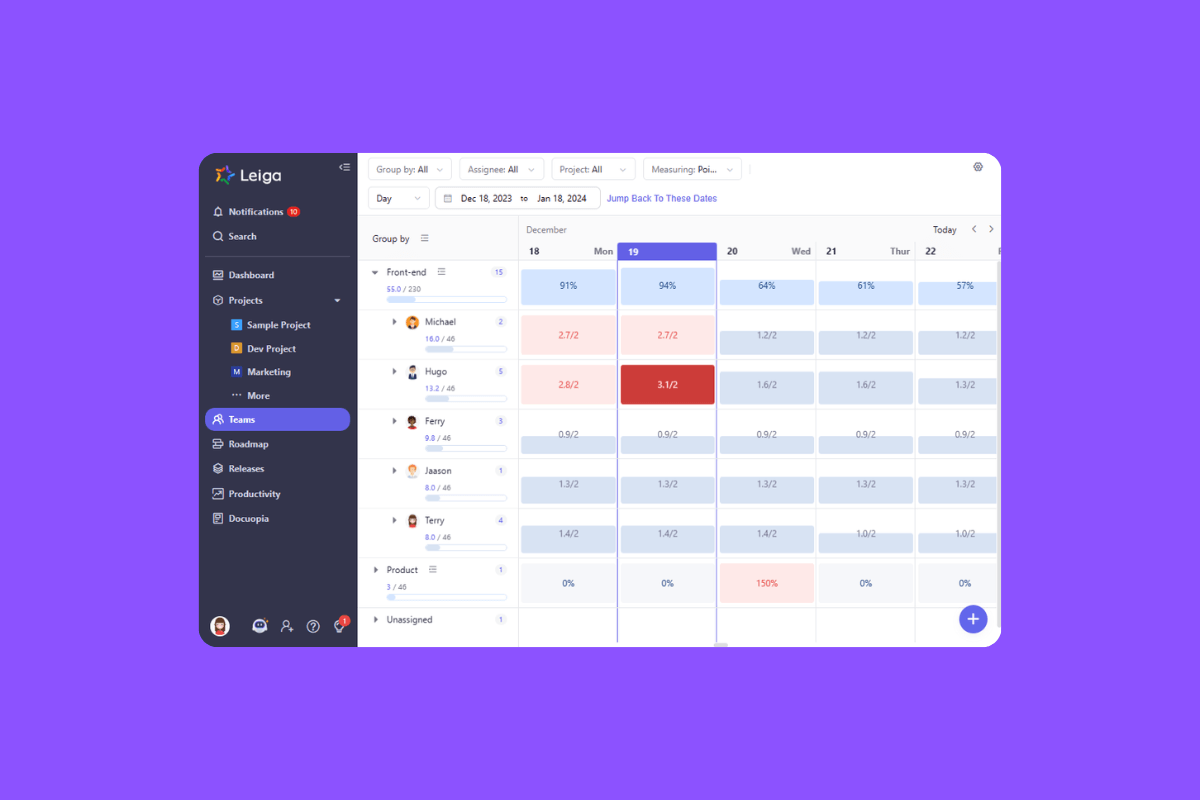
2. Smarter Workload Balancing
AI-driven tools don’t just blindly distribute the tasks. They analyze, instead, the workload across all the team members. If one member is overburdened, the system can either automatically reassign the work or adjust the deadline, which is something that cannot be done with traditional Gantt charts.
Read More: Boost Team Efficiency: How Leiga Simplifies Workload Management
3. Predictive Insights and Alerts
By relying on data from prior projects, AI makes it possible to detect risks earlier, just like when a certain task is getting delayed or a dependency is likely to result in a delay. Instead of confronting the problems, project managers would be able to stop them.
4. Seamless Collaboration
The latest project management applications come with Slack, GitHub, email, Notion, and other integrations, making updates flow naturally from one platform to another. Thus, your Gantt chart transforms from a mere scheduling tool to a communication center for the whole team.
5. Customizable Views
Every role sees what matters most. Modern Gantt tools adapt to context, not the other way around.
- Executives see timelines and milestones.
- Developers see sprint tasks.
- Designers see dependencies.
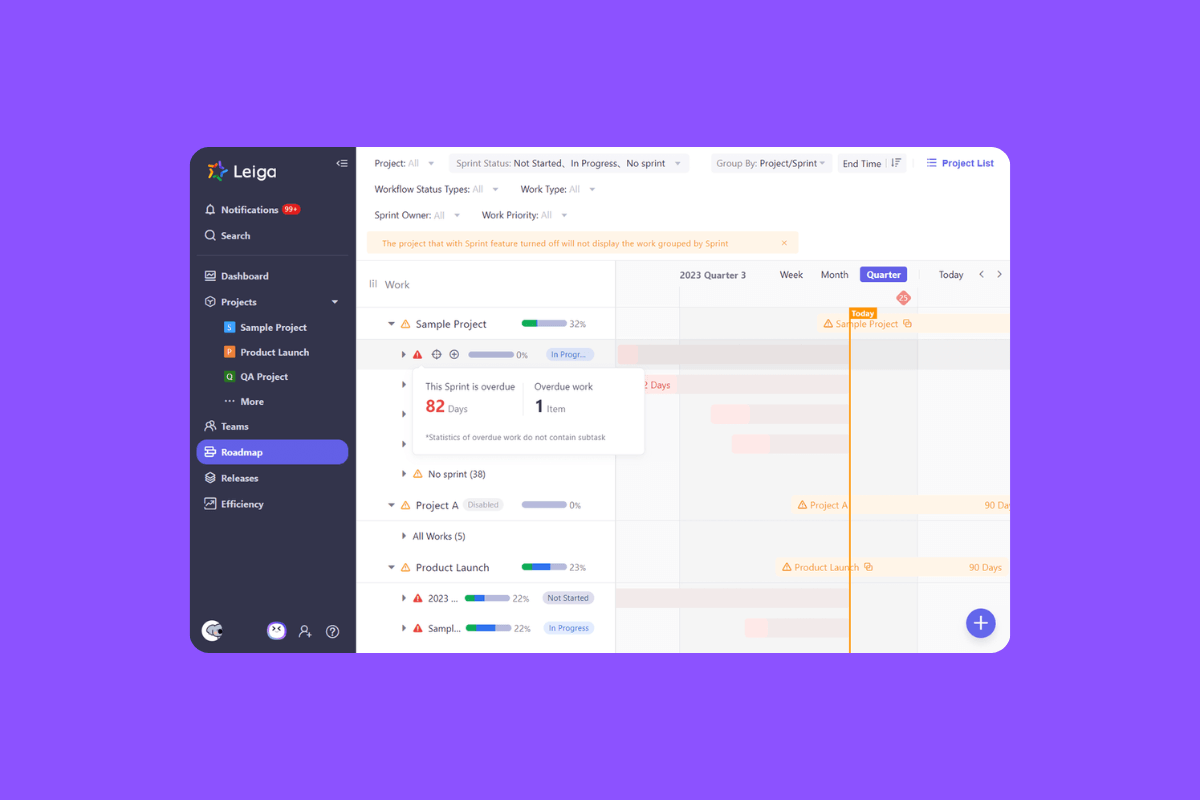
How Leiga Reinvents Project Planning
Leiga takes the Gantt chart a step further by blending automation, AI, and smart insights into one cohesive platform. Instead of being “just another project tracker,” Leiga acts as your AI-powered project partner—making planning smarter, not harder.
Read More: AI-Powered Task Management Software: A Game Changer for Dev Teams
Here’s how:
1. Automated Updates That Keep Your Plans Alive
Leiga's smart automation system guarantees that your project plan remains alive over time. If a task is changed, postponed, or done, your Gantt chart will automatically show those new conditions. No manual dragging involved.
This results in less time spent on fixing spreadsheets and more time on execution. Visualize it as a self-healing project plan that is always current and trustworthy.
2. Fair and Data-Driven Workload Distribution
In lots of teams, the tasks are not evenly divided. A few people get really exhausted, while others are just waiting for their turn to do tasks.
Leiga's AI workload balancing takes into account the availability of each team member and guides you to give out tasks in a fair and efficient way. Rather than estimating who is available, you are absolutely sure who can take more work and who is due for a timeout.
3. Smart Insights for Faster Decisions
Standard Gantt charts depict what is taking place. Leiga does more. It enlightens you as to the reasons and what action to take next.
For instance:
- It pinpoints possible bottlenecks before they become real problems..
- It forecasts which milestones might be delayed based on the current advancement rate.
- It converts intricate timelines into digestible insights for stakeholders.
With Leiga, each update turns into a chance to enhance your project.
4. Seamless Integration with Your Workflow
Leiga doesn’t replace your favorite tools, it connects with them. From your design software to development trackers and communication channels, everything stays in sync.
That means no more switching tabs to update different tools or sending endless status reports. Leiga’s modern Gantt view brings it all together in one place.
Read More: Reducing Cognitive Load in Dev Teams Through Connected Tooling
5. A Gantt Chart Built for Modern Teams
Whether you’re running agile sprints, hybrid projects, or traditional workflows, Leiga adapts. You can toggle between a Gantt timeline, Kanban board, or list view without losing data or context. This flexibility makes it easy to visualize progress in the format that best fits your team’s style.
The Real-World Impact: From Chaos to Clarity
To understand the difference, let’s imagine two teams managing the same project.
Team A: Using Traditional Gantt Charts
- Updates are done manually.
- Delays go unnoticed until the next status meeting.
- Some team members are overloaded; others are idle.
- The project manager spends more time maintaining the chart than managing the project.
Result: Missed deadlines, frustrated teams, and endless status calls.
Team B: Using Leiga
- Updates happen automatically.
- The AI flags risks before they escalate.
- Tasks are distributed fairly based on real workload data.
- Everyone stays aligned through connected tools and real-time visibility.
Result: A project that runs smoothly, predictably, and collaboratively.
The difference isn’t just in the tool. It’s in how intelligently it adapts to the team.
Why It Matters: The Future of Project Planning
Project management is no longer about static planning, it’s about adaptive execution. Modern tools like Leiga represent the evolution of project management philosophy: from control to collaboration, from tracking to insight.
Here’s what defines the new era of project planning:
- Automation replaces manual effort.
- AI replaces guesswork.
- Real-time data replaces static charts.
The Gantt chart, once a rigid structure, becomes a living blueprint for success.
How to Transition from Traditional Tools
If your team still relies on outdated Gantt tools, making the switch can seem daunting.
Here’s a simple framework to guide you:
1. Audit Your Current Process
List what’s working and what’s holding your team back. Manual updates, lack of visibility, or data silos are some factors you should consider.
2. Define What You Need
Do you want automation, AI predictions, better collaboration, or all of the above? Clarify your priorities before choosing a tool.
3. Test a Modern Platform
Try out a smart project management tool like Leiga. Experiment with its Gantt view, automation rules, and insights dashboard. You’ll immediately see how much time and friction it removes from planning.
4. Roll Out Gradually
Start with one project, one department, or one sprint. Once your team gets comfortable, expand usage across more projects.
5. Measure the Impact
Track metrics like time saved on updates, project accuracy, and team satisfaction.
You’ll likely find what many others have once you go automated, you’ll never go back.
Smarter Tools, Smarter Teams
The Gantt chart has transformed tremendously from the early paper timelines of Henry Gantt. The future, however, is not about leaving it behind but rather about reinventing it to meet your needs.
Project planning with the help of Leiga and similar tools is becoming more dynamic and engaging as they merge automation, AI, and cooperation. In a changing world of project management, a plan that is alive and adjustable is not a luxury but a requirement.
Leiga gives that edge to the teams by transforming every update, insight, and task into an even smarter, faster route to success. Standard Gantt charts just tell you the current position. Leiga, on the other hand, guides you to your destination and provides ways of reaching it.
Read More: Smarter Project Reports with AI: Turning Every Update into Actionable Insight
Leiga: The Future of Project Management
Leiga is not only a project management tool; it is an AI partner that works together with you for the entire workflow process.
Through automated updates, intelligent workload balancing, and data-driven insights, it makes it easier for teams to plan, adjust, and execute without any problems.
Join in the experience of next-generation project planning now! Try Leiga, where smart planning meets real progress.
- Streamline Your Workflow with Leiga
- Effortlessly automate tasks
- Boost productivity with AI insights
- Free forever — elevate project management