The Gantt chart is a project management tool that has survived for over a hundred years. It is a simple visual timeline that has helped the teams to plan, track, and deliver work in a wide range of areas, from massive construction projects to modern software sprints.
Modern Gantt charts are dynamic and interactive and very different from the old-fashioned versions of Gantt in the early 1900s. It has gradually changed through the different ages of industrialization, digitization, and AI.
Let’s explore how the Gantt chart came into existence, its role in project management, and the impact of AI on Gantt charts.
The History: Henry Gantt and the Industrial Age
The Gantt chart found its name and its early influence from Henry Laurence Gantt, an American mechanical engineer and management consultant.
In the early 1900s, at the time of the Second Industrial Revolution, factories and large-scale projects were at their peak. However, project planning was a messy affair. Managers depended on lengthy textual schedules and handwritten notes with no visibility and consistency.
Henry Gantt became aware of the problem. Time and progress were the two factors that needed visualization by the teams.

The Breakthrough Idea
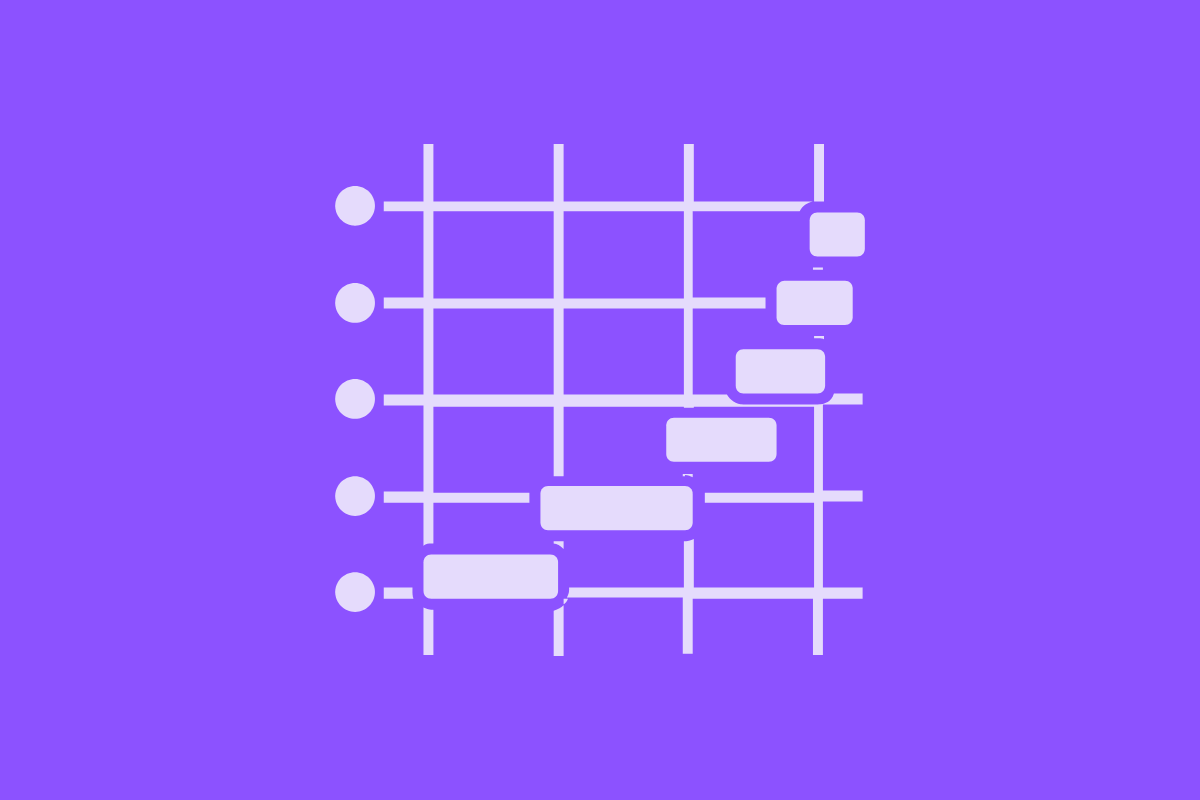
It was between 1910 and 1915 that Gantt created a charting system in which tasks were represented along a time axis. The length of each bar shows the time taken for the task, allowing the managers to see the following.
- When the work started and finished
- How many tasks were running in parallel
- If the progress was ahead or behind the schedule
Although the visual representation was very simple, it changed the whole management practice.
Gantt Charts in Action
During World War I, Gantt's charts were first applied in shipbuilding and enabled the U.S. Army to supervise the production timelines. Accountability and planning no longer suffered, as visualization proved to be very effective.
By the 1920s, Gantt charts became a standard tool across the globe for various industries such as manufacturing, building, and engineering.
Early Project Planning Tools: Manual to Mechanical
As the industries grew, projects also became more complicated. It was difficult to manage many tasks on paper, often leading to mistakes in work.
Back then, Gantt charts were usually made by hand on big paper or using big boards. Updating them as often as they wanted was very difficult and time-consuming for project managers because it involved erasing and redrawing the whole thing.
The Mechanical Era Begins
Large companies in the 1950s and 1960s started to play with mechanical materials such as sliding bars and magnetic boards. These physical systems made it easier to update, but still, manual input was necessary.
This was the time when project management was recognized as a distinct subject. The Critical Path Method (CPM) and Program Evaluation and Review Technique (PERT) tools were developed. They support the Gantt chart and offered more accurate ways to deal with dependencies and timelines.
However, Gantt charts were still the primary visual tool. Despite the existence of room-sized computers, managers still liked the simplicity of horizontal bars more than the complexity of networks with nodes and arrows.
The Digital Revolution: Gantt Charts Go Online
The 1980s and 1990s saw an enormous transition, when computers became more common in offices.
With the introduction of spreadsheets and desktop applications, the way of making and modifying Gantt charts completely changed. Changing the duration or date of a task can now be done automatically and instantly. No need to remake the entire chart with changes.
Read More: Still Using Spreadsheets to Track Coding Projects? Here Are 3 Free Tools to Try Instead
The Introduction of Microsoft Project And The Software Boom
Microsoft came up with Microsoft Project in 1984, and it was one of the first software tools to support digital Gantt charts. That was a groundbreaking development.
Digital Gantt charts gave teams an advantage:
- No more manual updates and recalculations
- One could simply drag-and-drop to schedule tasks
- Dependencies and resource tracking were integrated
- Project timelines could be shared electronically
Tools like Primavera supported and enabled the Gantt chart to become a digital planning staple, launched after.
By the early 2000s, Gantt charts had completely moved from paper to screen. They had developed into interactive dashboards that could manage several projects and complex dependencies at the same time.
The Collaboration Era: Gantt Charts Meet the Cloud
As teams got more diverse, the traditional desktop tools had a hard time keeping pace with the changes. The 2010s were the years when cloud collaboration took over and Gantt charts started to appear on shared, real-time platforms.
From Isolated to Teamwork
No more exporting PDFs or emailing Excel files. The teams were able to sign in to the cloud-based software and change the Gantt charts together. The use of cloud Gantt charts brought some major improvements:
- Instant Updates: Every change was immediately seen by all.
- Cross-Team Visibility: The product, design, and engineering teams could all work off the same timeline.
- Tool Integration: Gantt charts could now acquire data from task management tools, calendars, or even CRMs.
The Gantt chart was not just a representation of the schedule. It transformed into the project’s living document that instantly reflects the project’s progress and goals.
Read More: AI-Powered Task Management Software: A Game Changer for Dev Teams
The AI Age: Smarter, Predictive, and Automated
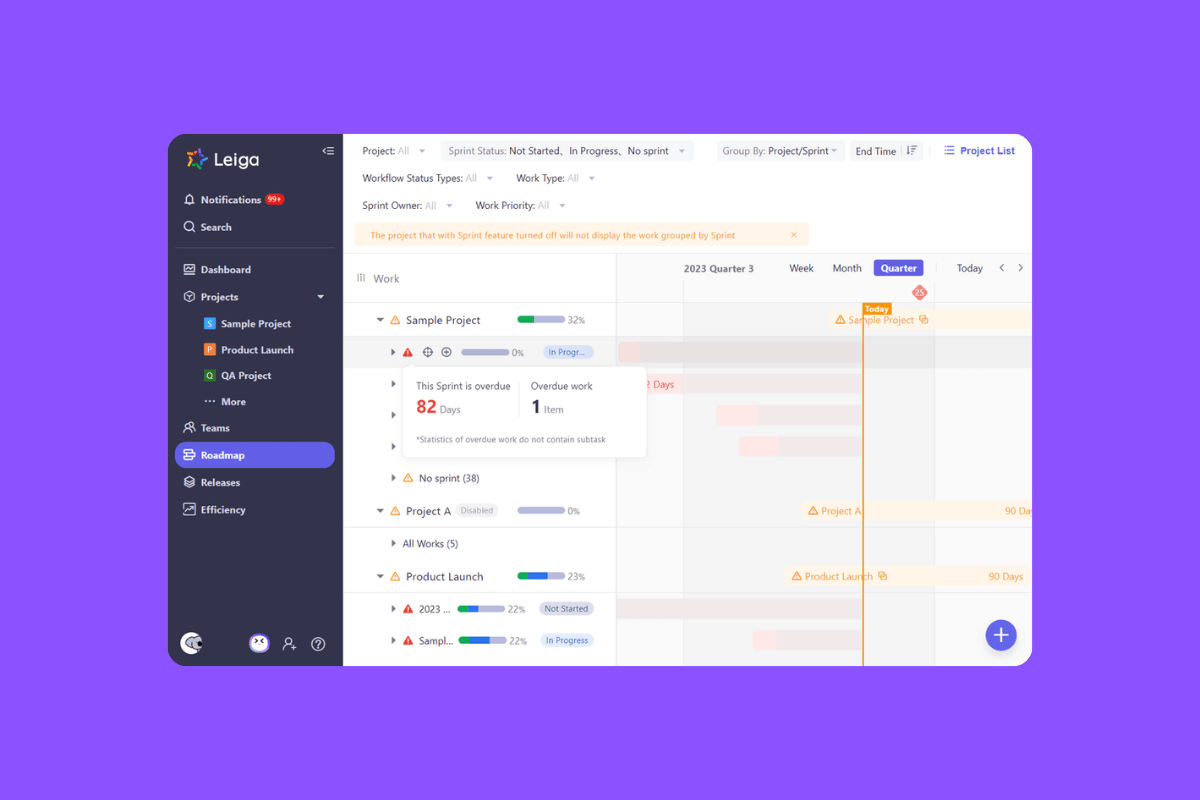
The 2020s is the time when project management got the power of AI. The Gantt chart is transforming once more. AI-driven systems, like Leiga, are not only providing task visualization features. They also offer predictive analysis, risk assessments, and even recommended adjustments to help teams adjust their workflows.
How AI Transforms Gantt Charts
Let’s have a look at how artificial intelligence is raising Gantt charts to a new height:
- Automation: AI is capable of making customized automations for updates, subtask generation, and task progress out of simple-language requirements.
- Predictive Insights: AI can predict which tasks will cause delays by analyzing historical data and workflows and then suggesting recommended adjustments.
- Natural Language Processing (NLP): AI helpers can read task descriptions and automatically assign timelines, dependencies, and owners.
- Adaptive Planning: When priorities change, AI can quickly recalculate project timelines and recommend ideal reassignments.
Gantt charts are transforming into dynamic, smart systems that are learning from the data and reacting to it rather than just showing it passively.
From Reactive to Proactive
Classic Gantt charts can only show the current state of projects. AI-empowered Gantt charts demonstrate the likely future scenarios so teams can act on them to prevent bottlenecks and ensure that projects are delivered on time.
This predictive move is one of the largest changes in project management since the inception of Gantt's method.
Read More: Smarter Project Reports with AI: Turning Every Update into Actionable Insight
The Human Element: Why Gantt Charts Still Matter
Despite all the technological advances, the core value of Gantt charts remains unchanged — clarity.
Whether on paper or in a digital dashboard, teams still need a clear, visual representation of how work fits together. The simplicity of seeing tasks along a timeline is universal. AI may automate the process, but the goal remains the same. Help teams see the path forward and stay aligned every step of the way.
The Gantt chart is still used not just because it’s functional, but because it’s intuitive. It speaks the language of time and progress, something every team understands.
The Future of Gantt Charts: AI + Contextual Intelligence
The next generation of Gantt charts will be more than schedules, they’ll be decision-support systems.
Imagine Gantt charts that:
- Highlight at-risk milestones before they slip
- Auto-adjust resource allocations based on capacity
- Summarize progress using natural language
- Connect insights from performance metrics directly into the timeline
This is where AI and data-driven context merge to make project management not just easier but smarter. The Gantt chart, once a manual tool for tracking timelines, is now a command center for strategic insight.
From Paper to AI: A Century of Progress
To appreciate how far we’ve come, here's the Gantt chart’s evolution in one glance:
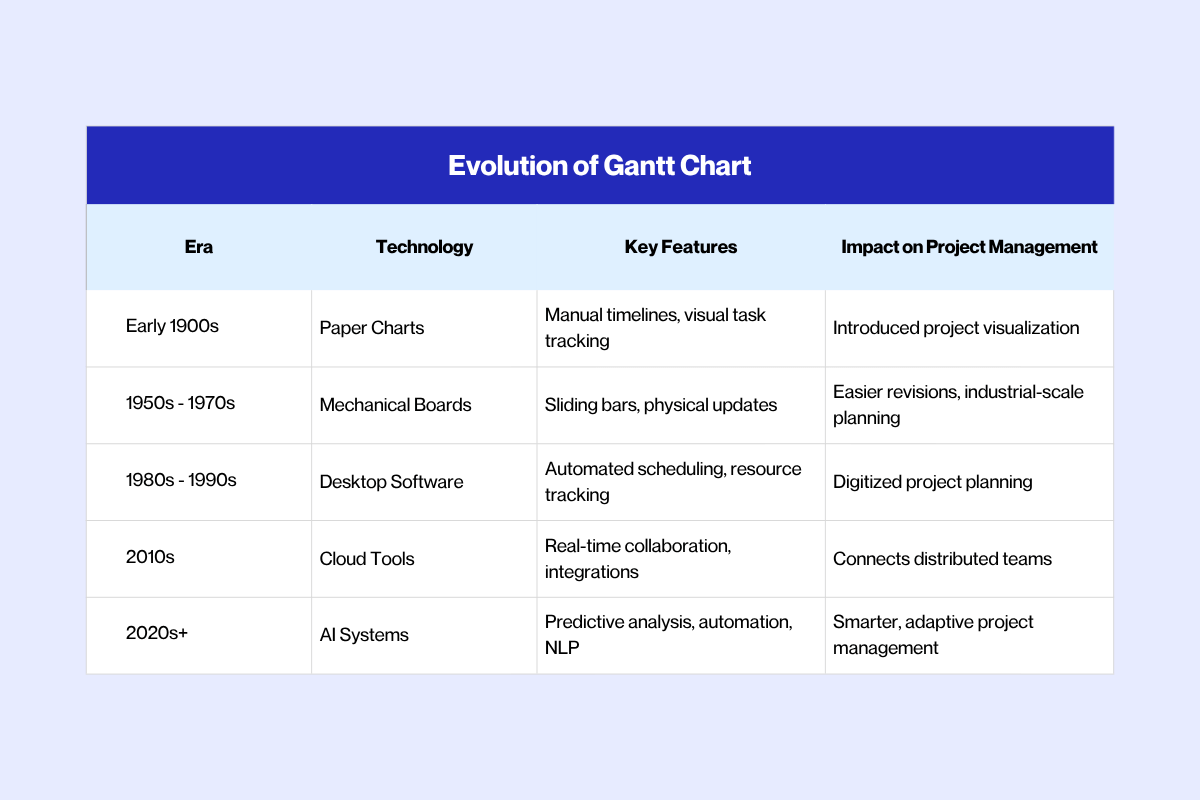
From hand-drawn bars to machine learning-powered insights, the Gantt chart remains the backbone of project planning.
Leiga: Where Gantt Charts Meet Intelligent Automation
While the traditional Gantt chart focused on visual timelines, Leiga takes it further. Combining automation, AI insights, and intelligent reporting in one seamless experience.
Smarter Planning, Simplified Execution
Leiga’s AI-driven Gantt charts automatically generate and update based on your project inputs. No more manual date setting or chasing dependencies. Leiga intelligently adjusts timelines as tasks evolve.
- Auto-Generated Timelines: Simply describe your project, and Leiga’s AI turns it into a structured, visual plan.
- Dynamic Adjustments: When deadlines shift or new tasks appear, Leiga instantly updates your Gantt view to keep everything aligned.
- Insight Reports Built-In: Teams go beyond visuals. Leiga translates your Gantt data into actionable insights and summaries, helping teams make data-informed decisions.
- Better Collaboration: Everyone sees the same data. Clear progress, dependencies, and milestones in real time.
From Charts to Intelligence
Leiga isn’t just digitizing Gantt charts, it’s redefining them. By employing AI into the heart of project visualization, it transforms static schedules into intelligent, self-updating systems that empower teams to plan smarter and execute faster.
The result? Less manual work, fewer blind spots, and more time spent building what matters.
From Henry Gantt’s early paper timelines to today’s AI-powered project intelligence, the Gantt chart has evolved alongside our tools, technology, and teamwork.
Its history is a reflection of a timeless need: to bring order to complex projects. And as tools like Leiga continue to innovate, one thing is clear, the future of project management will be as intelligent, adaptive, and automated as the projects it helps deliver. Experience intelligent, adaptive project management. Try Leiga for free today.
- Streamline Your Workflow with Leiga
- Effortlessly automate tasks
- Boost productivity with AI insights
- Free forever — elevate project management